Innocuous little streams that become raging torrents have been part of people’s lives since time immemorial, as shown not least by the various high-water marks that you can find in nearly every town or village. They are a good clue to what years saw severe flooding. “Of course, high-water marks are one sign,” Roggenkamp says. “You can see from them how high the river came up.”
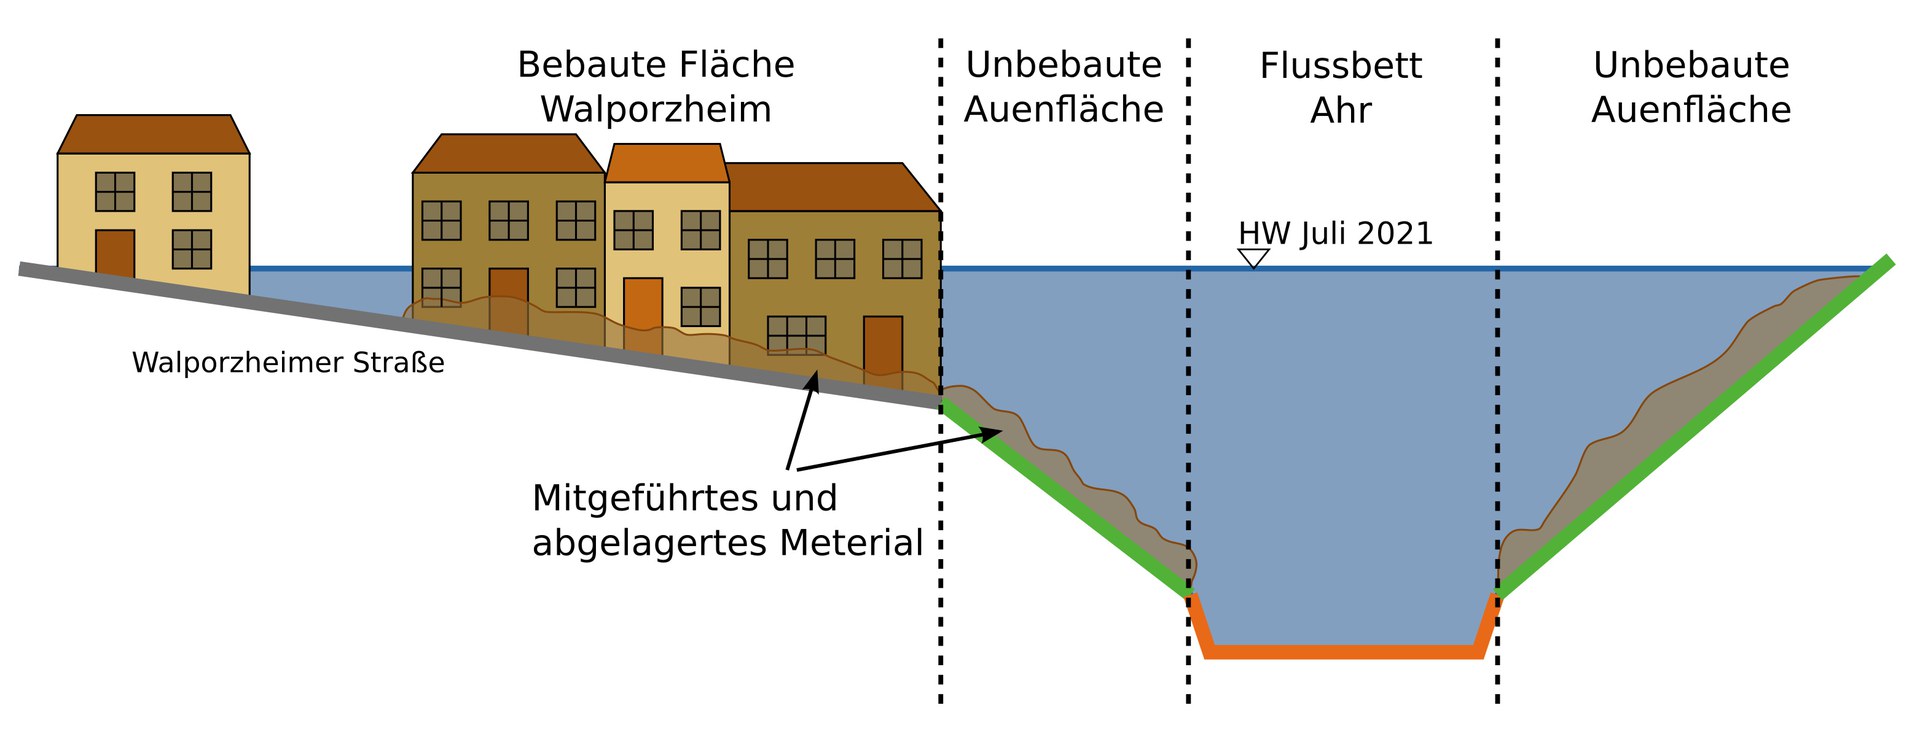
But the markers on house walls are of little use when it comes to making a comparison. “In many places, the topography changed significantly over the centuries,” Roggenkamp points out. “Rivers were straightened, deepened or narrowed; bridges and houses were built. The road level is also changing. All of this is influencing the space and also how fast the river flows.” The vegetation, surface area and gradient of the water table also play a role.
peak discharge helps comparing floods
The peak discharge, i.e. the volume of water that is discharged when the water level is at its highest, is therefore more meaningful when comparing floods, he says. But calculating it requires detective work: Roggenkamp visited town and city archives, analyzed historical maps, scrutinized photos that can be compared with modern-day pictures and also consulted old drawings of bridges and tunnels that had been made when the land was surveyed. These he used to model transverse profiles of sections of the landscape.
Initial calculations show that, at their peak, the floods of 1804 and 2021 both discharged a similar amount of water. In 1804, the rate was just over 42,300 cubic feet (around 1,200 cubic meters) per second. For the 1910 floods, it was even possible to make an accurate reconstruction of how events developed hour by hour. “The level was much higher recently because the Ahrtal is more densely built-up now than it was back then. The water wasn’t able to drain away so quickly.”
Flood-like rainfall in summer also in 1804 and 1910
All three of the exceptional floods happened in summer. “Looking back through history, we’ve been able to find floods of a similar size. Time and again, written sources mention summer flooding in June and July after long periods of rainfall,” Roggenkamp reveals.
The size of the recent flood along the Ahr is not necessarily a consequence of climate change. “You can’t use one flood to predict future events,” he says. Nevertheless, he believes that climatologists’ predictions of more frequent heavy rainfall events affecting certain locations are indeed accurate.
Although the flooding on the Ahr only pushed the level of the Rhine up slightly, Roggenkamp was also struck by how powerfully the river flowed: following the Ahr, he is now reconstructing discharge values from historic floods along the Rhine – from Roman times to the present day.


